Property in Singapore prices always go up. The next low is higher.
Across two decades, every cycle has bottomed higher than the one before it. Dips are real — but they are floors, not ceilings. That is the core case for treating property as a portfolio you hold through cycles, not a bet you time.
Overall Singapore Real Estate — 2006 to 2026
A composite price index across HDB, condos and landed homes. One line, twenty years — a steady climb where every dip bottoms higher than the last.
Illustrative composite based on URA Property Price Index and HDB Resale Price Index trends, 2006 = 100. Approximate values for discussion only.
What actually drives Singapore property growth.
Prices rise because supply is rationed, demand keeps growing, and the system around land is engineered for stability. Six forces do most of the work — together they explain why each low sits above the last.
Land scarcity by design
Singapore is 735 sq km with about 20% of land reclaimed. The government master-plans every parcel, keeping supply deliberately tight so land behaves more like a managed commodity than an open market.
A growing, well-housed population
From ~4.4M (2006) to ~6M+ today, with home-ownership above 80%. Demand keeps climbing even as the household shrinks — more singles and smaller families mean more homes per person.
Stable governance & rule of law
Predictable policy, a strong currency, and transparent land titles make Singapore a safe harbour for capital — local and foreign — in good cycles and in crisis.
Global capital inflow
Low taxes, open capital flows and a regional financial hub status pull in foreign and PR buyers, especially in downturns elsewhere — a recurring floor under prices.
Wage & income growth
Real incomes have risen over the period. Rising wages translate into bigger mortgages, larger CPF flows, and a structurally higher ceiling for what homes can be priced at.
Inflation hedge & infrastructure
Property is the classic inflation hedge, and Singapore compounds it with constant rail, amenity and precinct upgrades that lift surrounding values year after year.
20 Years of Singapore Property Prices — by Type
Price index, 2006 = 100. HDB resale, private condos, and landed homes all trend up — each trough higher than the previous low.
- HDB
- Condo
- Landed
Read the troughs, not just the peaks. The Global Financial Crisis low (2009) sat above the 2006 base. The 2013 cooling-measures low (2014–2017) sat above the 2009 low. The COVID low (2020) sat above the 2017 low. By 2026 all three segments are multiples of their 2006 level — landed most of all, because its supply is the most fixed.
Each type plays a different role. HDB is the broad market — it moves with incomes and policy, the steadiest line. Condos add a private-market premium and more cycle sensitivity. Landed is the scarcest tier and compounds hardest, but is the least liquid when you need to exit. The portfolio question is which mix of these lines you hold, and how you sequence between them.
Illustrative composite based on URA Property Price Index and HDB Resale Price Index trends. Index values are approximate and for discussion only — your portfolio review uses the precise figures.
99-Year Leasehold vs Freehold
Freehold compounds with the market. A 99-yr leasehold rises, then decays as the lease runs down.
- Freehold
- 99-yr Leasehold
Same market, two outcomes. A freehold home compounds with the market indefinitely — its value is tied to land. A 99-yr leasehold is a depreciating asset with a market overlay: it rises while the lease is long, then the declining balance of lease value begins to outweigh market gains.
The crossover matters for your exit. In the back half of the lease — roughly past year 40–50 — resale demand narrows, financing tightens, and the price decouples from freehold peers. Plan the exit before that window closes.
Illustrative. Lease decay accelerates in the back half of the lease — a key reason holding power and exit timing matter.
By Region in Singapore
Average price per sq ft across the three planning regions and HDB maturity segments.
Three regions, three demand drivers. CCR (Core Central) commands a premium driven by foreign and investor capital. RCR (Rest of Central) is the city-fringe value play — amenities without the prime price. OCR (Outside Central) is where most Singaporeans live and upgrade; it moves most with local incomes and new-launch supply.
HDB has its own geography. Mature estates (e.g. Bishan, Queenstown, Toa Payoh) carry a scarcity premium — established amenities and limited new supply. Non-mature estates run cheaper but catch up fastest when a new MRT line or precinct master plan lands nearby.
Illustrative averages. CCR = Core Central, RCR = Rest of Central, OCR = Outside Central.
The takeaway for your portfolio.
Prices trend up with higher lows, but the line you ride depends on type, tenure and region — and on whether you can hold through the dip to reach the next high. That is exactly what our framework stress-tests before you buy.
Hover a pin. See what each district trades at.
An indicative map of average private condo price per sq ft across Singapore. Move your cursor over a pin to reveal the figure for that area.




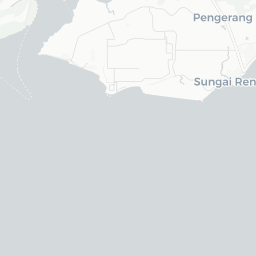
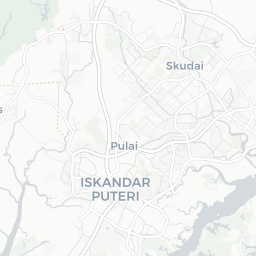
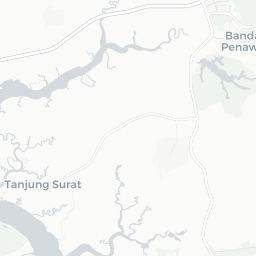


Indicative averages for illustration only. Actual psf varies by project, age, tenure and prevailing market — your portfolio review gives you the precise figures for the districts that matter to you.
Two decades, one direction. The composite index has more than doubled since 2006, with three visible pullbacks — the Global Financial Crisis (2009), the 2013 cooling measures (2014–2017), and COVID (2020). Each ended higher than where the previous one began.
That shape is the whole thesis. A 2.3× move over twenty years, delivered through multiple crises, is not luck — it is the result of rationed land, rising incomes and stable policy working together. Hold through the dip, and you reach the next high.